



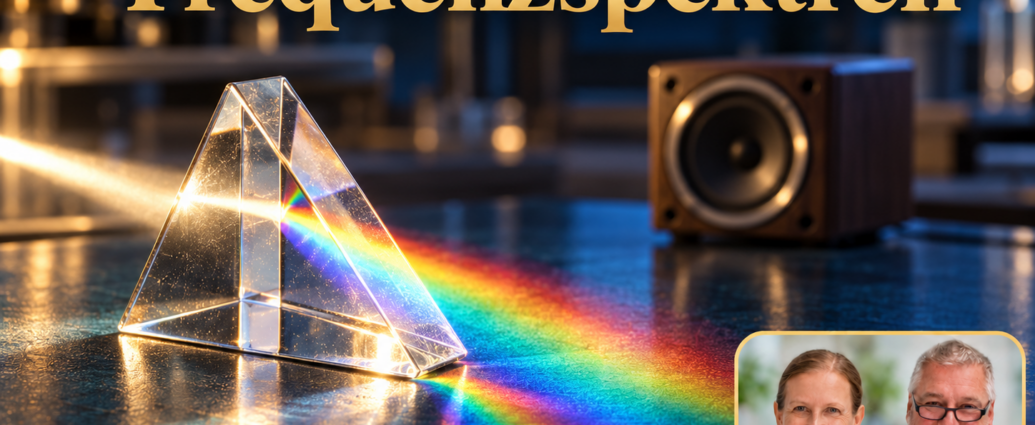
Frequency spectra classify oscillations according to their frequency. Here, a fundamental distinction must be made: sound is a type of mechanical wave. Radio waves, visible light, and gamma radiation, on the other hand, belong to the electromagnetic spectrum. The fact that both can be described in hertz does not make them the same type of wave or similar in their effects. [1]
This overview covers everything from low-frequency sound to ultrasound and the realm of electromagnetic radiation. It is intended to help you interpret tables, device specifications, and statements about „frequencies“ more accurately. The key question in each case is: What is oscillating, how is it transmitted, and what additional information do we need to make a meaningful assessment?
Frequency spectra require clear assignment
With sound, a disturbance is transmitted through matter. In air, this results in pressure changes that propagate. Electromagnetic waves are based on electric and magnetic fields and do not require a material medium to propagate. That is why starlight reaches us even through largely empty space. [1]
When you compare two values with the same number in hertz, you initially know only one temporal rhythm. An oscillating object and a varying electrical signal can share this rhythm, even though the processes are different. The similarity is comparable to two processes of equal duration: their duration alone does not imply an identical effect.
A spectrum can also describe the composition of a specific signal. In that case, it shows which frequency components are present and to what extent. This is different from a chart that lists specific ranges of sound or radiation side by side. Therefore, be sure to read the title and the axis labels of a graph first.
Infrasound, audible sound, and ultrasound
As a rough guide, the human hearing range is often specified as approximately 20 Hz to 20 kHz. Lower frequencies are referred to as infrasound, and higher frequencies as ultrasound. This classification applies to sound. It does not guarantee that every person perceives the entire range mentioned with the same degree of clarity. [2]
These three terms do not describe three completely distinct laws of nature. They classify mechanical vibrations based on their frequency and their relationship to human perception. You should view the lower and upper limits as a general guide. When determining whether a specific sound source is perceived, a frequency value alone is not sufficient.
An audible sound can be soft or loud; this same distinction between frequency and intensity remains important even outside the normal range of human hearing. „Inaudible“ is therefore not a complete description of an exposure, nor is it evidence of a specific health effect. The actual exposure must be investigated independently.
Ultrasound images are created from sound waves and echoes
In ultrasound imaging, high-frequency sound waves are emitted and the returning echoes are analyzed. The travel time and intensity of the signals provide information for the image. Unlike X-rays, this method does not use ionizing radiation. The FDA also notes that ultrasound introduces energy into the body and should be used properly. [3]
This example illustrates why the name of a frequency range is only the beginning of an explanation. An ultrasound image requires a suitable transducer, a defined setup, and interpretation. The medical conclusion is derived from the entire procedure and the examination itself, not solely from the presence of a high frequency.
Therefore, the established use of a particular method does not imply that any other „frequency applications“ are valid. When comparing two offers, their technology and purpose must actually be the same. A similar name or the same unit is not sufficient for this purpose.
Radio Waves and Microwaves
Radio waves are electromagnetic waves. A radio receives an electromagnetic signal and uses its electronics and speaker to convert it into audible sound. The received carrier frequency is therefore not the same as the frequency of each reproduced sound. Technical processing takes place between reception and hearing. [4]
Microwaves fall within the higher-frequency portion of the radio spectrum, but are often treated as a separate band. They are used, among other things, for communications, radar, and Earth observation. NASA explains that different microwave bands are used for different measurement tasks. The term therefore does not refer to a single type of device. [5]
When reviewing a table, note whether microwaves are listed as a subset or in a separate column. Both approaches can be appropriate depending on the context. An apparent overlap between sections is not automatically an error; often, different classification rules have been used. The key is that these rules remain clear.
Infrared and visible light
Infrared lies beyond the red end of the visible spectrum. We encounter it, for example, in thermal imaging cameras and certain remote controls. A thermal imaging camera makes infrared radiation visible through a technical representation; the colors in its image are assigned by the image processing system and are not infrared colors seen directly by the eye. [6]
Visible light comprises only a small portion of the electromagnetic spectrum. As a general guide, NASA specifies wavelengths ranging from about 380 to 700 nanometers. Violet light is at the short-wavelength end, while red light is at the long-wavelength end. Accordingly, violet light has a higher frequency than red light. [7]
The order is important because frequency and wavelength have an inverse relationship when the speed of propagation is constant. If the wavelength increases in a graph, the frequency decreases. Therefore, check the direction of the axis before comparing two graphs. Otherwise, a color gradient arranged in the opposite direction can easily lead to an incorrect conclusion.
Ultraviolet, X-ray, and gamma radiation
Ultraviolet light has shorter wavelengths than visible light. It is classified into UVA, UVB, and UVC, among others. The fact that UV radiation is invisible to the eye does not prevent it from interacting with matter. NASA, for example, describes the potential damage caused by UVB radiation and the role of the atmosphere in shielding against it. [8]
Compared to visible light, X-rays have significantly shorter wavelengths and higher photon energies. The difference in attenuation within the material being imaged enables imaging. Gamma rays are observed, for example, during radioactive decay and high-energy cosmic processes. Appropriate detectors are required for their analysis in each case. [9], [10]
The terms listed in an overview should not be interpreted as a rigid ranking of useful or dangerous waves. A professional assessment requires knowledge of the specific process, the amount or intensity used, the duration, and the material involved. For medical procedures, the benefits and risks of the specific application must also be considered.
Distinguishing Between Frequency, Wavelength, and Energy
Electromagnetic radiation can be described in terms of frequency, wavelength, or photon energy, among other things. A higher frequency means a higher energy per photon. However, the energy of a single photon does not indicate how much total radiation energy strikes a surface. The number of photons—or the photon flux—is also relevant for this. [11]
As a thought experiment, consider comparing two light sources of the same color. Even if their photons have similar energies, the total power output need not be the same. Conversely, a change in color describes a different property than simply making a lamp brighter. Keep these issues separate when reading a data sheet.
Even observing an effect does not automatically determine its cause. If the temperature changes during an experiment, the experimental setup, power, duration, and any other possible influences must be taken into account. Only a proper comparison can reveal the actual contribution of the observed change in frequency.
How to Carefully Interpret Statements About Frequencies
Start with the type of wave: Is it mechanical sound, an electrical signal, or electromagnetic radiation? Next, check whether the number describes a single frequency, a range, or a time-dependent curve. A range of values without a unit is just as incomplete as a unit without reference to the measured process.
Next, look for the intensity of the effect and the measurement location. Does the device specify an output value, or a value actually measured at the target? This distinction prevents the description of a transmitter from being confused with the description of an exposure. Missing information should remain recognizable as open-ended questions.
When it comes to health-related statements, there is another layer to consider: What specific effect was studied, using which method, and in which individuals? A general spectral overview does not lead to a diagnosis or provide evidence of treatment. A clear explanation combines technical details with the precise statement that the appropriate examination actually allows for.
Frequently Asked Questions About Frequency Ranges
Does ultrasound become radio waves at even higher frequencies? No. The nature of the process remains the decisive factor. Simply increasing a numerical value does not replace a physical conversion process. Sound and electromagnetic radiation must still be considered separately.
Does a source have only one frequency? That depends on the source and how it is described. For example, a single number may refer to a specific portion or a key piece of information. If necessary, ask for the full range and how the number was calculated.
What information is most important when getting started? First, determine which physical quantity is being referred to. If this identification is correct, it becomes much easier to meaningfully compare units, frequency ranges, and applications. The highest number listed in a table is, by itself, neither an indicator of quality nor a recommendation.
Sources and Further Information
- NASA: Anatomy of an Electromagnetic Wave. Retrieved October 27, 2026.
- OpenStax: University Physics, Volume 1, Chapter 17: Introduction. Retrieved October 27, 2026.
- FDA: Ultrasound Imaging. Retrieved October 27, 2026.
- NASA: Radio Waves. Retrieved October 27, 2026.
- NASA: Microwaves. Retrieved October 27, 2026.
- NASA: Infrared Waves. Retrieved October 27, 2026.
- NASA: Visible Light. Retrieved October 27, 2026.
- NASA: Ultraviolet Waves. Retrieved October 27, 2026.
- NASA: X-Rays. Retrieved October 27, 2026.
- NASA: Gamma Rays. Retrieved October 27, 2026.
- NASA Imagine the Universe: Electromagnetic Spectrum – Introduction. Retrieved October 27, 2026.



Comments are closed, but trackbacks and pingbacks are open.